Emissions Categories
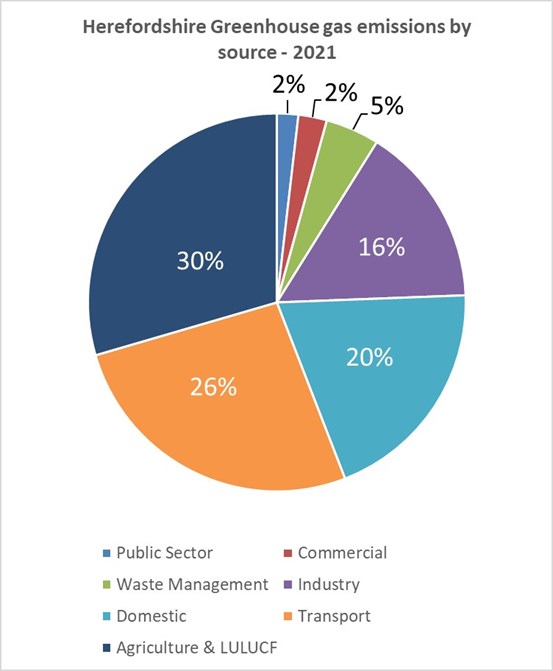
The table and pie chart below show the relative proportions of each emissions category. Here, agriculture and LULUCF emissions have been placed together, with the negative emissions from land use reducing the agriculture total. This is to aid presentation of the information. The clear links between agricultural operations, livestock management and land use do support these categories being presented together.


-
-
- The emissions sources are grouped into end-user categories. The categories describe the emissions source and for most categories this is derived from the quantity and type of energy used by those sectors.
- Land Use, Land Use Change and Forestry (LULUCF) differs in that the emissions are produced from the land itself rather than energy consumption. Woodlands and permanent grasslands absorb carbon dioxide, removing emissions. Croplands, wetlands and settlements all produce emissions. These are combined to produce a net emissions figure, which is a negative figure for Herefordshire. This is due to the principle land use being pasture.
- This includes all land use types and the majority is land used for agriculture and forestry. Other land uses are settlements and land used for recreation and amenity that is usually woodland and grassland.
- Emissions from agricultural soils and livestock are included in the Agriculture sector.
-

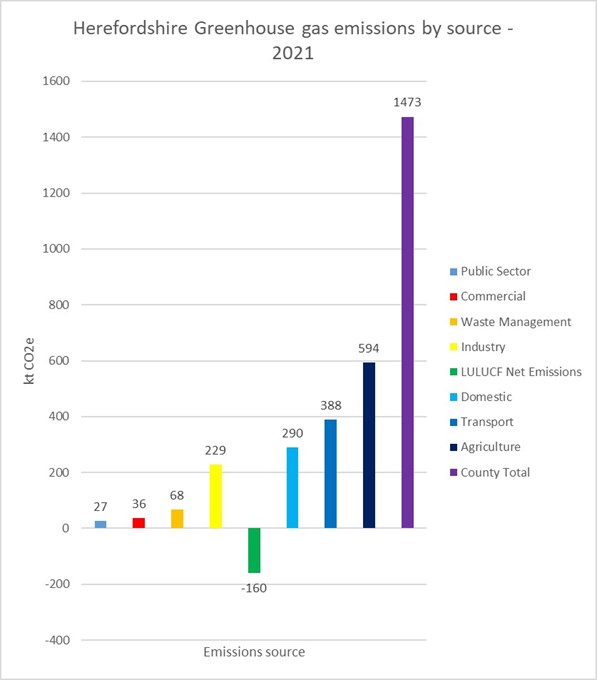
The graph shows the greenhouse gas emissions by source. There are measured in kilo tonnes of carbon dioxide equivalent and are: Public sector, 27 ktCommercial, 36 kt; waste management, 68 kt; Industry, 229 kt; Land Use, Land Use Change and Forestry, -160 kt; Domestic, 290 kt; Transport, 388 kt; Agriculture, 594 kt; Total = 1473 k

