Producing the emissions figures
Greenhouse gases
-
- Herefordshire Council has previously used the UK Government data to measure emissions of carbon dioxide at the County level.
- Carbon dioxide is produced from the combustion of fossil fuels, but other greenhouse gases such as methane from livestock and land were not included.
- Carbon dioxide alone does not provide a complete picture of the County’s emissions as these other warming gases can be significant.
- The Herefordshire Climate and Nature Partnership aimed to widen emissions monitoring to include other greenhouse gases.
- Since 2018, the UK Government datasets have included emissions estimates that include carbon dioxide, methane and nitrous oxide.
- This provides a complete dataset of emissions for the County and these datasets covering a basket of greenhouse gases are now used.
- This has significantly changed the figures from previous data that included carbon dioxide only.
-
- County level data is produced by National Statistics on behalf of the Department of Energy Security and Net Zero.
- Data is compiled in arrears and so the 2023 dataset release provides data for the period 2005-21. With each new years’ data release previous years’ figures are revised. This is to maintain consistency in the methodology and reflects improvements in data collection and understanding of emissions sources and the warming potential of various gases.
- County level datasets are not available prior to 2005, but UK level data is available to 1990. This can be used to model the estimated County emissions from 1990-2004, based on a proportion of the UK total.
- These are territorial emissions that quantify the sources of the emissions within the County. This includes the energy used in the production of goods and services but these are not necessarily consumed within the County.
- Emissions are measured in kilo-tonnes of Carbon dioxide equivalent. Greenhouse gases each have a different capacity for warming, but can all be quantified as an equivalent of carbon dioxide.
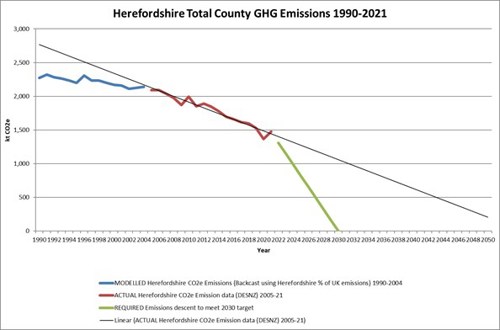
This graph shows Herefordshires’ greenhouse gas emissions from 1990-2021.
The period 1990-2004 is modelled from UK level data. Emissions were 2274 kt CO2e in 1990 and fell to 2141 kt CO2e in 2004.
The period 2005-2021 is actual County level emissions estimates. Emissions were 2091 kt CO2e in 2005 and fell to 1473 kt CO2e in 2021. This is a reduction in emissions of 35% since 1990.
The graph also shows the linear trend of emissions reduction based on the figures in the period 2005-21 and the descent required to reach net zero emission in 2030.